
Turning Portfolio Insight Into Action
PRODUCT MARKETING / CUSTOMER EDUCATION CASE STUDY
problem statement
Monorail’s Investment Analyzer showed users what their existing portfolios supported. But complex holdings data and unfamiliar scoring could make the results difficult to understand.
I helped turn that complexity into clearer product messaging, progressive education, and guided next steps that built trust and supported conversion into Patriot Portfolios.
During the campaign window, new Patriot Portfolios increased 74%, from 298 to 518.
Objectives
- Understand how users interpret portfolio holdings, alignment scores, and flagged companies
- Identify where complex financial data created confusion or hesitation
- Build trust through clear language, transparent sources, and inspectable data
- Help users move from insight to action without pressure or manipulation
- Support a scalable analyzer experience that could handle large portfolios
Goals
- Make portfolio alignment easier for mainstream investors to understand
- Give users a clear summary first, with deeper inspection available when needed
- Reduce cognitive load when reviewing hundreds of holdings
- Create a trustworthy path from analysis to next steps
- Help product, design, and compliance align around a clear analyzer framework
my process
From Portfolio Confusion to Product Clarity

Define the User Questions
I mapped the core questions users needed answered: What do I own? What does it support? Can I trust this score? What should I do next?

Structure the Disclosure Model
I helped shape a progressive experience that moved from simple summary to deeper inspection across scores, categories, holdings, and sources.

Insight Into Customer Education
turned research findings into recommendations for navigation, scoring, drilldowns, source visibility, product messaging, and conversion paths.
Qualitative Research & Ideation
We analyzed competitor analyzers, financial product patterns, user questions, mobile portfolio flows, AI-assisted ideation, and cross-functional feedback to understand how the analyzer could make complex portfolio data easier to trust.
Key Observations
- Users needed a simple summary before they were ready to inspect detailed holdings.
- Trust increased when users could drill down from a score into categories, companies, and sources.
- Large portfolios created scanning and navigation challenges, especially on mobile.
- Users were more comfortable connecting accounts when the experience used familiar Plaid-style patterns.
- Conversion prompts had to be carefully placed so the product felt helpful, not pushy.
Inferences
- The analyzer needed to lead with clarity, then offer depth.
- Progressive disclosure was the best way to balance simplicity and credibility.
- Source visibility was essential for trust.
- Dense tables and pagination would create unnecessary friction on mobile.
- The path from analysis to action needed to respect user choice and compliance boundaries.
Research Findings
Defining Real User Needs

Instant Clarity
Users needed to quickly understand the meaning of their portfolio analysis without financial jargon slowing them down.

Credible Depth
Users needed the ability to inspect scores by category, holding, company, and source to verify the reasoning behind the analysis.

Compliant Transparency
Users needed clear explanations, dated assessments, and careful language that prevented misunderstanding.

Guided Action
Users needed a clear next step after reviewing their analysis, but they did not want to feel pressured into transferring or activating anything.
Recommendations Turned Into Product Decisions
To support the research findings, the analyzer was structured around clarity, trust, inspectability, and responsible conversion.
Plaid Connection
A familiar account connection flow helped reduce friction and build confidence when users connected outside brokerage accounts.
Dated Assessments
Each analysis included a timestamp so users could understand when their portfolio was reviewed and why results might change over time.
Impact Scoring
A single headline score gave users a fast summary, while deeper views allowed them to inspect the reasoning behind the result.
Violation Drilldowns
Expandable categories and holding-level views helped users understand specific conflicts without overwhelming them.
Smart Navigation
Filtering, sorting, and preview states helped users explore large portfolios more easily on mobile.
Conversion Bridge
Calls to action gave users a path from insight to activation while respecting user intent, choice, and compliance boundaries.
High Fidelity Screens
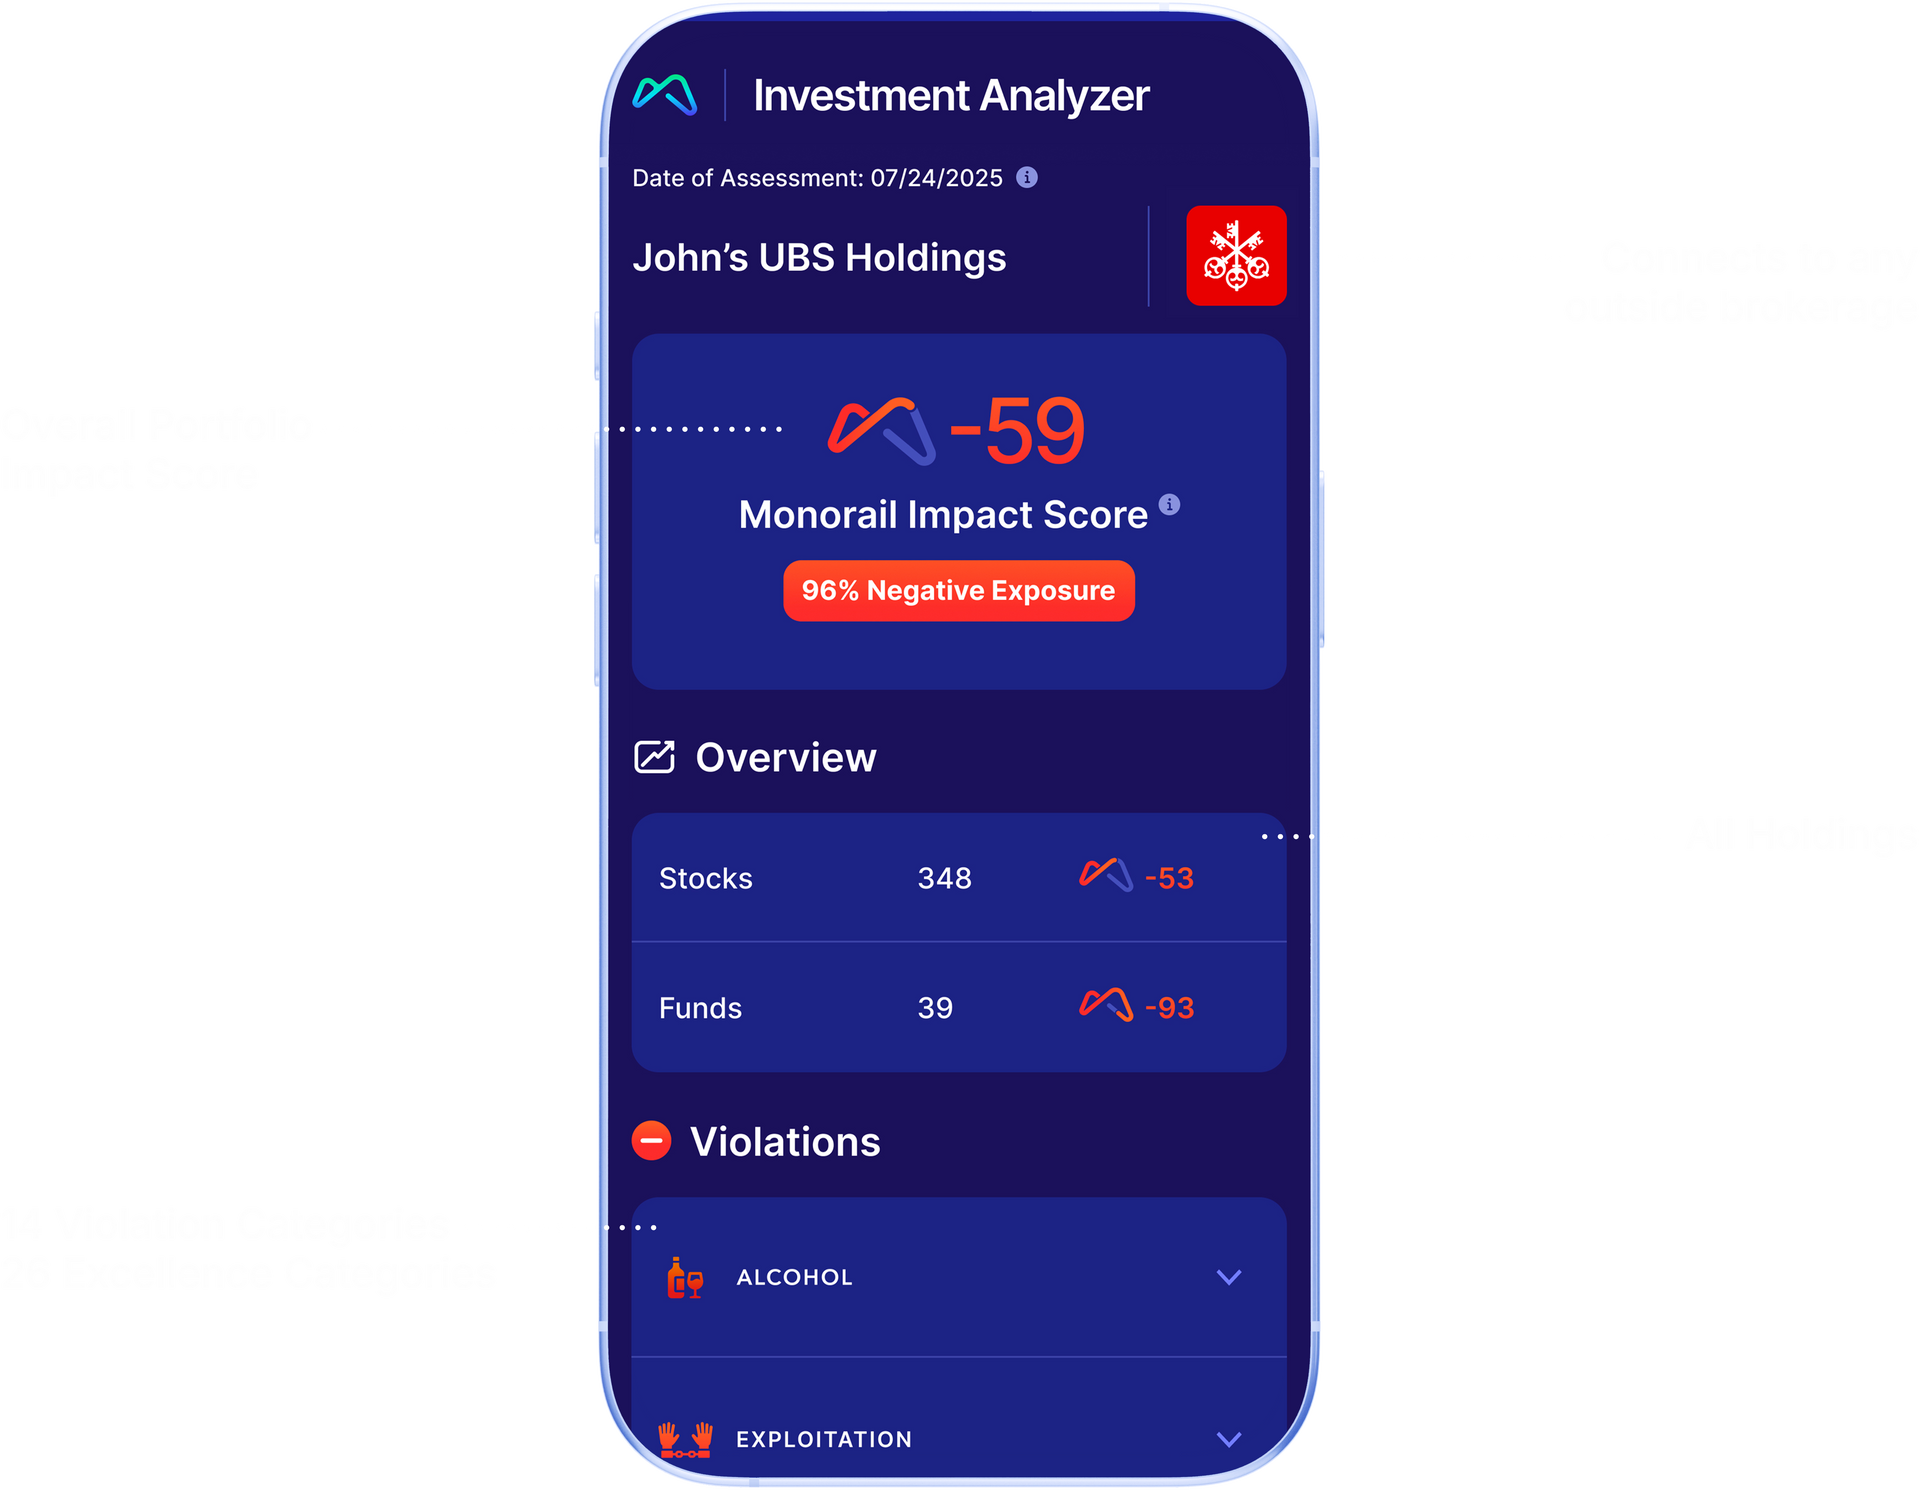

The user can drill down into specific flagged holdings and understand why they were identified.

When no major violations are found, the experience shows a clean state with supporting context and positive alignment signals.

Users can explore categories where their holdings show positive alignment.
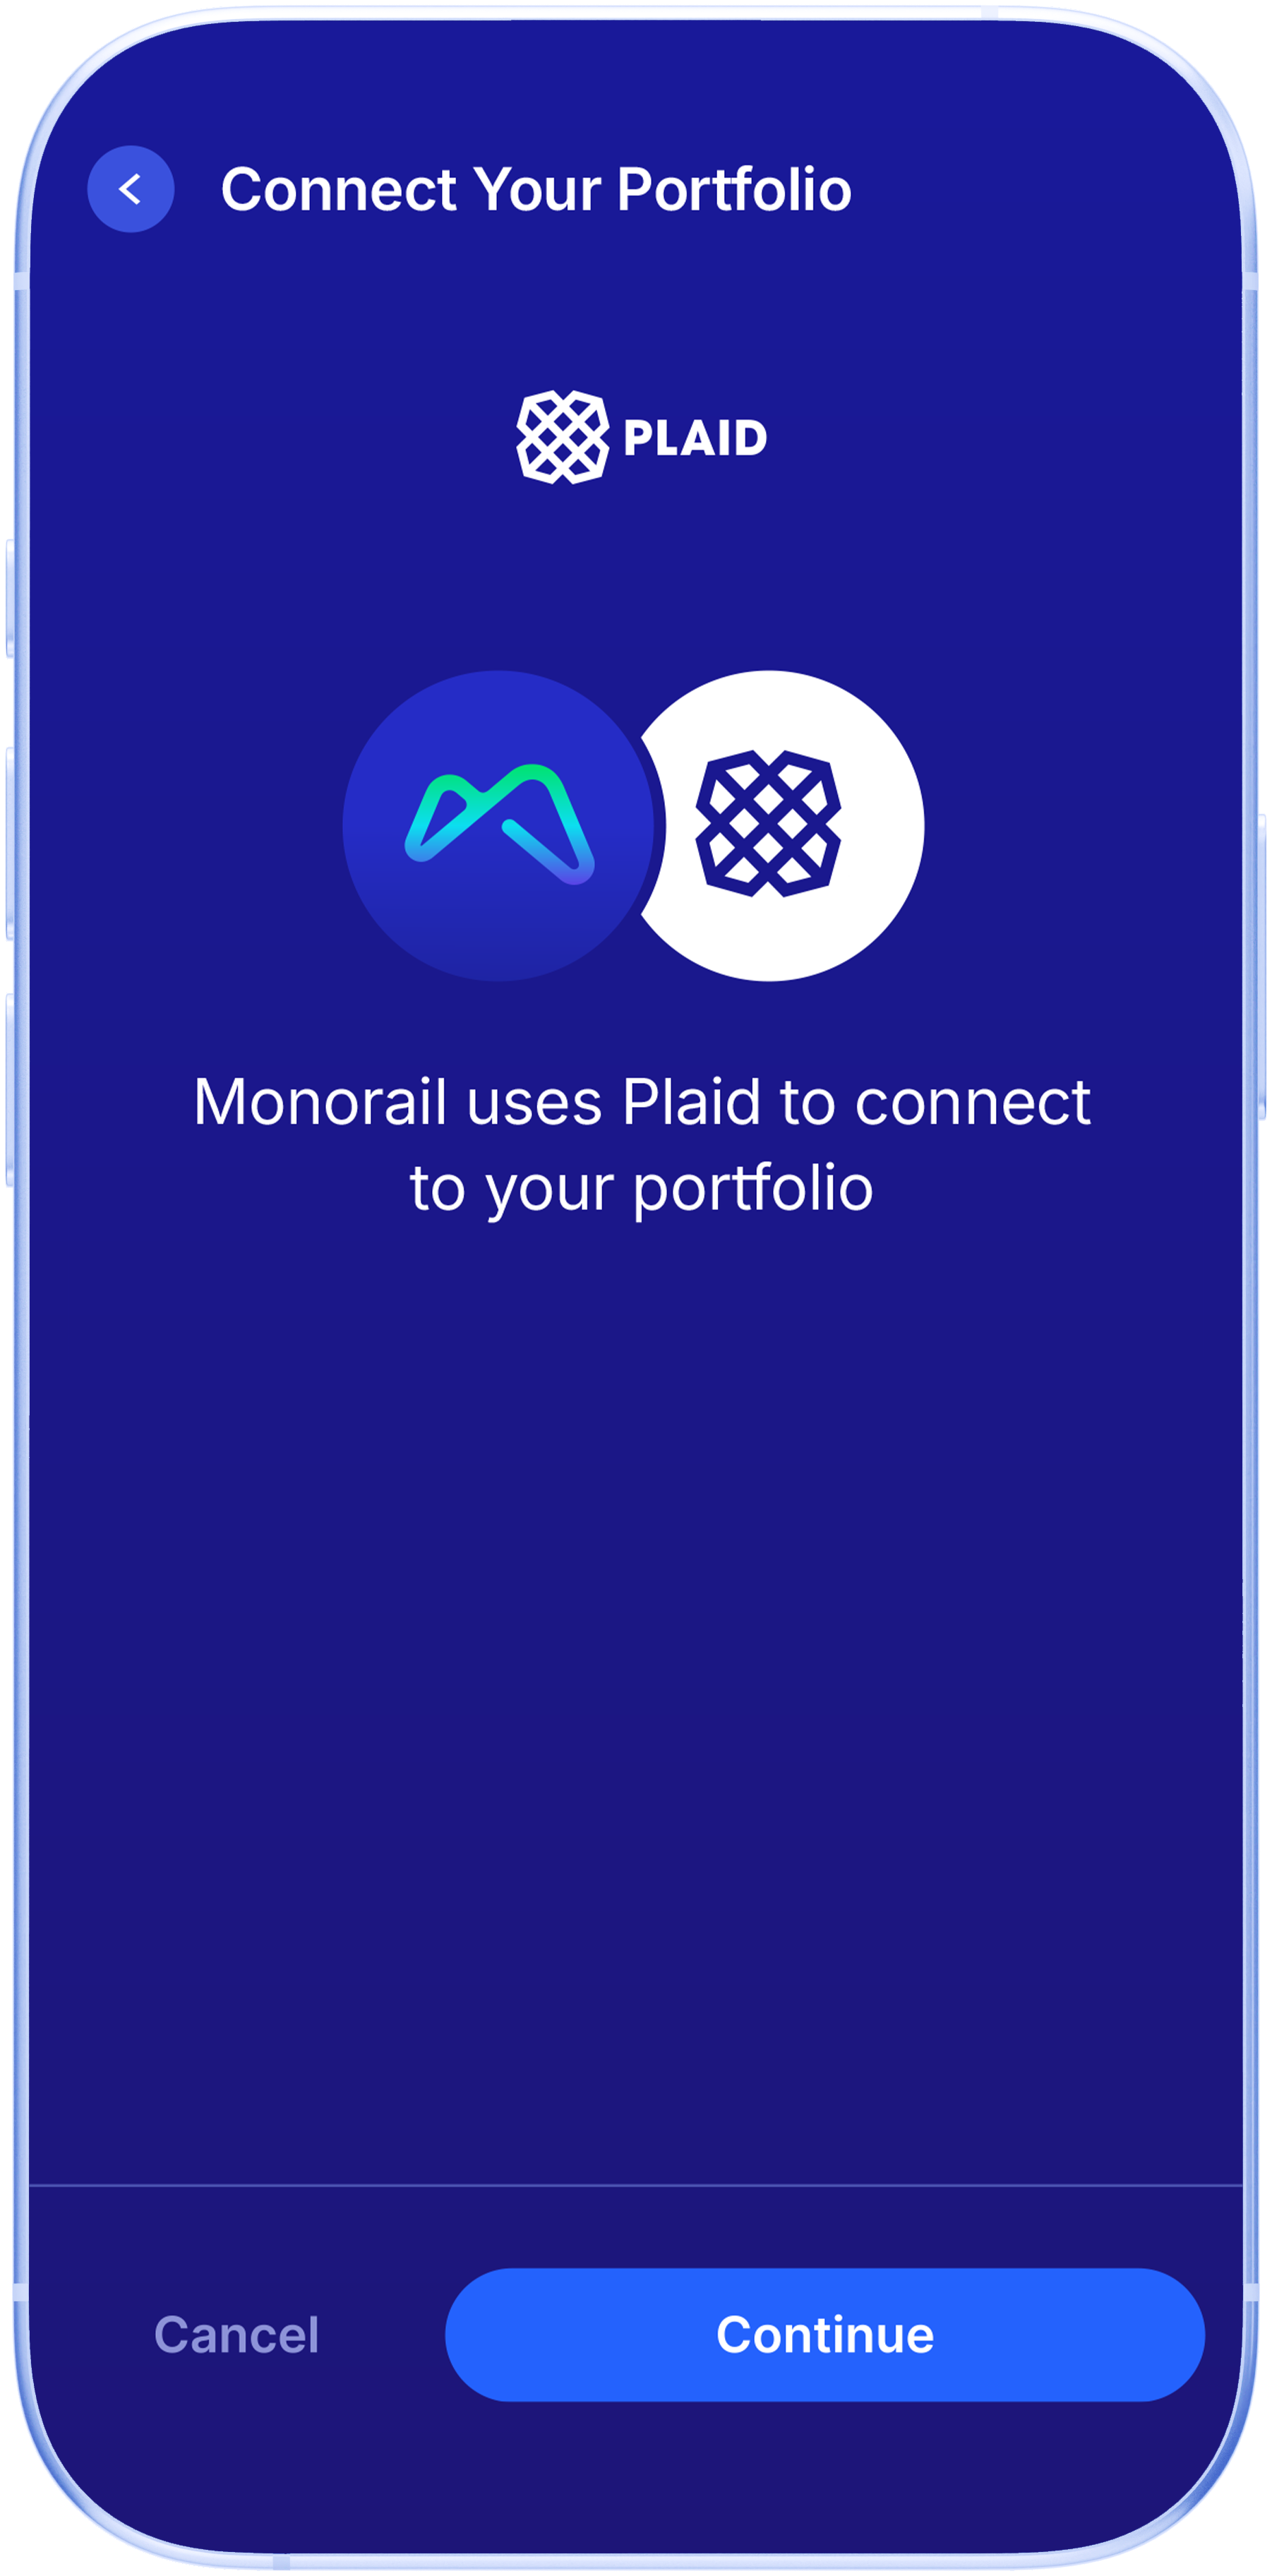
Users connect outside brokerage accounts through a familiar, secure account-linking flow.

Users can inspect individual companies and review the reasoning behind their score or category.

After connecting outside holdings, the product can suggest a transfer path without forcing the decision or creating pressure.
outcome
The Investment Analyzer helped turn a complex user question into a clearer product experience: What do I own, what does it mean, and what can I do next?
By leading with a simple score and giving users a path into deeper inspection, the experience made portfolio transparency easier to understand and easier to trust.
The work helped Monorail create a more credible bridge between user insight and product activation. It gave users a clearer view of their holdings, gave the team a scalable analyzer framework, and supported a more responsible path from portfolio review to next steps.
Most importantly, the analyzer made complex financial data feel less intimidating and more actionable.
Let’s Talk
I’m currently open to Marketing Manager opportunities. If you think I could help your team, fill in the form or call to set up a meeting at (315) 530-5269 or email me at gregorylifanov@gmail.com